Problem
Peatland holds a lot of water. When canals are dug through it, for plantations or access, they drain that water out. The peat dries, sinks, and becomes far easier to burn, which is why drained peatland is behind many of Indonesia’s land fires. Restoration, such as blocking canals so the peat gets wet again, works, but budgets and field teams are limited.
The question the team had to answer: which peatland areas should be restored first? The answer had to be a map that planners could use to choose locations, not a list of general recommendations.
Data
The analysis combined national datasets with a canal map the team produced:
- Peat hydrological units and peat ecosystem function: the peat areas between rivers (or between a river and the sea), and which parts are meant for protection and which for cultivation.
- Forest and land fire areas, 2015–2022: where fires have burned.
- Peat ecosystem damage status: where the peat ecosystem has been officially classed as damaged.
- Canal map: drainage canals digitized by the team from Maxar (now Vantor) high-resolution satellite imagery. I digitized the canals for the Dumai area.
Method
1. Canal digitizing (Dumai)
Canals are the clearest sign that peatland has been changed: where there is a canal, water is leaving the peat. I traced the canals in Dumai by hand in QGIS from high-resolution Maxar imagery, so the team had a canal layer detailed enough to tell drained peat apart from peat that is still intact.
2. Restoration priority overlay
- Put all layers in the same coordinate system and clipped them to the peat area.
- Overlaid the layers so that every area carried its peat function, fire history, damage status and canal presence.
- Classified every area with a priority matrix: a rule table that turns each combination of those conditions into a class.
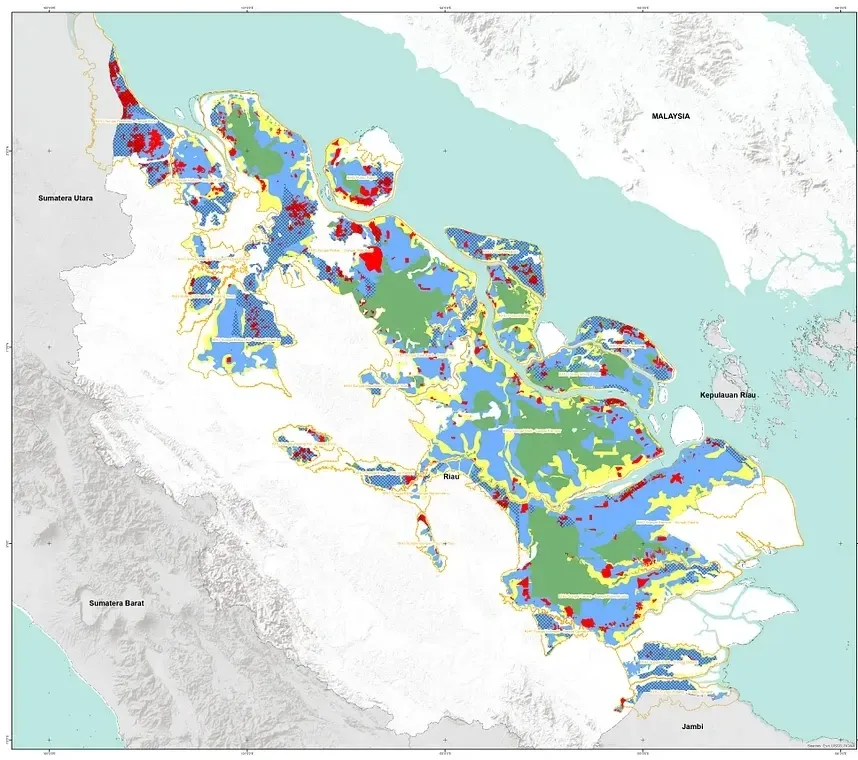
The map sorts peat into four classes:
- Protected peat with canals: peat meant for protection, but drained by canals.
- Peat burned in 2015–2022.
- Cultivation peat: peat zoned for use.
- Intact peat without canals.
On top of these classes, the matrix marks the priority restoration target areas.
Results
The canal layer shows where peatland has been changed by drainage. Combined with the other layers, it produced an indicative restoration priority map for Riau province: every peat area is assigned a class, and the target areas show planners where to start and why.
Lessons
- Canal data quality decides a lot: a missed canal can leave a drained area looking intact, and so marked as a lower priority.
- An indicative map shows where to look first. Field checks are still needed before restoration work starts.